go_plot plots GO terms that have been reduced using go_reduce.

go_plot(
  reduced_pathway_df,
  col_gene_list = "gene_list",
  col_fdr = "fdr",
  fct_gene_list = NULL
)

Arguments

reduced_pathway_df

the tibble derived from go_reduce.

col_gene_list

a character() vector, with the name of column containing the name(s) of the inputted gene list(s). Defaults to "gene_list".

col_fdr

a character() vector, with the name of column containing enrichment p-values/fdr-values. Defaults to "fdr".

fct_gene_list

a character() vector, with the order in which input gene lists should be factored. Defaults to NULL.

Value

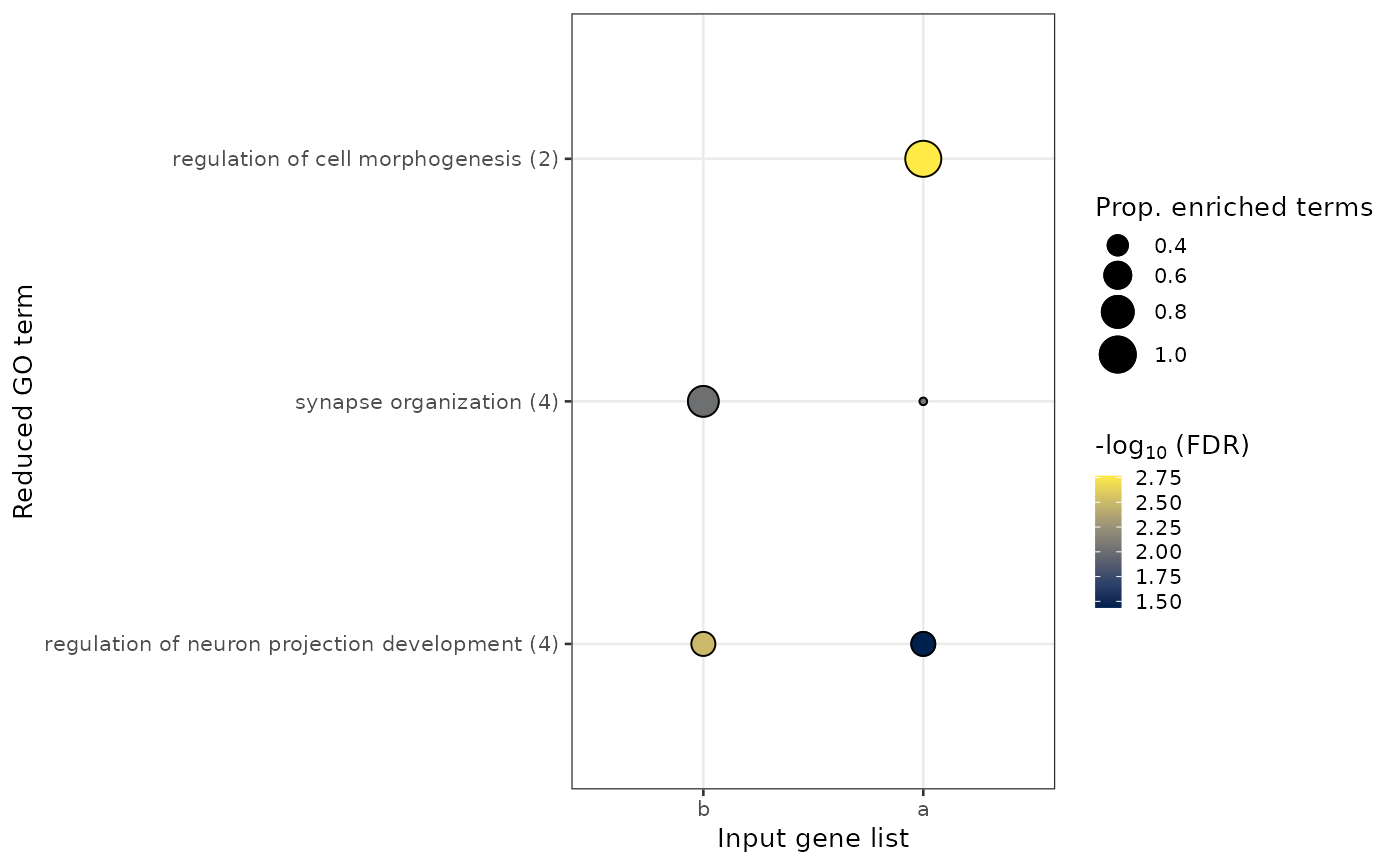
ggplot displaying the pathway enrichments using reduced perent terms.

  • x-axis displays the inputted gene list(s).

  • y-axis displays the reduced parent term, with the number of associated child GO terms in brackets. Parent terms are ordered first by the factoring of the input gene list (as provided in the argument, fct_gene_list) and then by the number of associated child terms.

  • size of the dot indicates the proportion of child terms associated with an inpute gene list that are annotated to the parent term.

  • fill of dot indicates the minimum FDR assigned to a child term that is associated with the parent term (within an input gene list).

See also

go_reduce for reducing GO terms

Other GO-related functions: go_reduce()

Examples

file_path <- system.file( "testdata", "go_test_data.txt", package = "rutils", mustWork = TRUE ) pathway_df <- readr::read_delim(file_path, delim = "\t" ) %>% dplyr::mutate( gene_list = c(rep("a", 5), rep("b", 5)), fdr = runif(10, min = 0, max = 0.05) )
#> #> ── Column specification ──────────────────────────────────────────────────────── #> cols( #> go_type = col_character(), #> go_id = col_character(), #> go_term = col_character() #> )
reduced_pathway_df <- go_reduce( pathway_df = pathway_df, threshold = 0.9, scores = NULL, measure = "Wang" )
#> [1] "Reducing sub-ontology: BP"
#>
#> Loading required package: org.Hs.eg.db
#> Loading required package: AnnotationDbi
#> Loading required package: stats4
#> Loading required package: BiocGenerics
#> Loading required package: parallel
#> #> Attaching package: ‘BiocGenerics’
#> The following objects are masked from ‘package:parallel’: #> #> clusterApply, clusterApplyLB, clusterCall, clusterEvalQ, #> clusterExport, clusterMap, parApply, parCapply, parLapply, #> parLapplyLB, parRapply, parSapply, parSapplyLB
#> The following objects are masked from ‘package:stats’: #> #> IQR, mad, sd, var, xtabs
#> The following objects are masked from ‘package:base’: #> #> anyDuplicated, append, as.data.frame, basename, cbind, colnames, #> dirname, do.call, duplicated, eval, evalq, Filter, Find, get, grep, #> grepl, intersect, is.unsorted, lapply, Map, mapply, match, mget, #> order, paste, pmax, pmax.int, pmin, pmin.int, Position, rank, #> rbind, Reduce, rownames, sapply, setdiff, sort, table, tapply, #> union, unique, unsplit, which.max, which.min
#> Loading required package: Biobase
#> Welcome to Bioconductor #> #> Vignettes contain introductory material; view with #> 'browseVignettes()'. To cite Bioconductor, see #> 'citation("Biobase")', and for packages 'citation("pkgname")'.
#> Loading required package: IRanges
#> Loading required package: S4Vectors
#> #> Attaching package: ‘S4Vectors’
#> The following object is masked from ‘package:base’: #> #> expand.grid
#>
#> preparing gene to GO mapping data...
#> No scores provided. Falling back to term's size
go_plot( reduced_pathway_df, col_gene_list = "gene_list", col_fdr = "fdr", fct_gene_list = c("b", "a") )
#> Joining, by = "parent_term"