Tutorial: querying genes across specificity matrices
Regina H. Reynolds
UCLregina.reynolds.16@ucl.ac.uk
3 February 2023
query_gene_ctd_tutorial.RmdAim
- Quick tutorial of
MarkerGenes::query_gene_ctd()function, which allows users to query a gene or several genes within several specificity matrices.
Mock example
- We will use the human gene, SNCA, as our mock example.
- We are only interested in SNCA’s specificity in human datasets, thus we will query the following datasets:
readxl::read_excel(
  path = here::here("metadata", "dataset_metadata.xlsx"),
  sheet = "Data"
  ) %>%
  dplyr::filter(species == "human", data_type == "SI_matrix") %>%
  DT::datatable(rownames = FALSE,
                options = list(scrollX = TRUE),
class = 'white-space: nowrap')- As AIBS2018_MTG is the more up to data of the AIBS datasets, we will
use this, together with Habib2017_DroNc_Human. In addition, we will be
using some of our own in-house single-nuclear RNA-sequencing from the
anterior cingulate cortex of control individuals (n = 7).
- It is worth noting that there are key differences in methodology between the AIBS dataset and the two remaining (i.e. Habib and our own in-house snRNA). While both sequence single nuclei, AIBS uses the SMART-Seq v4 kit, which permits sequence of full-length transcripts, while Habib and our in-house data use a 3’-tagging technology i.e. not full-length transcripts sequenced. This may have an impact on gene specificity.
- Let’s go ahead and load in these specificity matrices and query them for SNCA specificity.
- As we are only interested in SNCA’s specificity in overarching cell types, let’s limit this search to level 1 cell types.
# Load specificity matrices
load(here::here("specificity_matrices", "AIBS2018_MTG.rda"))
load(here::here("specificity_matrices", "Habib2017_DroNc_Human.rda"))
load(here::here("specificity_matrices", "Agarwal2020_SNIG.rda"))
#> Warning: namespace 'EWCE' is not available and has been replaced
#> by .GlobalEnv when processing object 'ctd_Agarwal2020_SNIG'

specificity <-
  MarkerGenes::query_gene_ctd(
    genes = c("SNCA"),
    ctd_AIBS2018, ctd_DRONC_human, ctd_Agarwal2020_SNIG,
    celltypeLevel = 1,
    median_included = F,
    genelistSpecies = "human",
    ctdSpecies = "human"
  )

# Plot
specificity %>%
  ggplot2::ggplot(
    ggplot2::aes(
      x = MarkerGenes::reorder_within(
        x = CellType,
        by = Specificity,
        within = Study,
        fun = median,
        desc = T
      ),
      y = Specificity)) +
  ggplot2::geom_col() +
  MarkerGenes::scale_x_reordered() +
  ggplot2::facet_wrap(ggplot2::vars(Study), scales = "free_x") +
  ggplot2::labs(x = "CellType") +
  theme_rhr
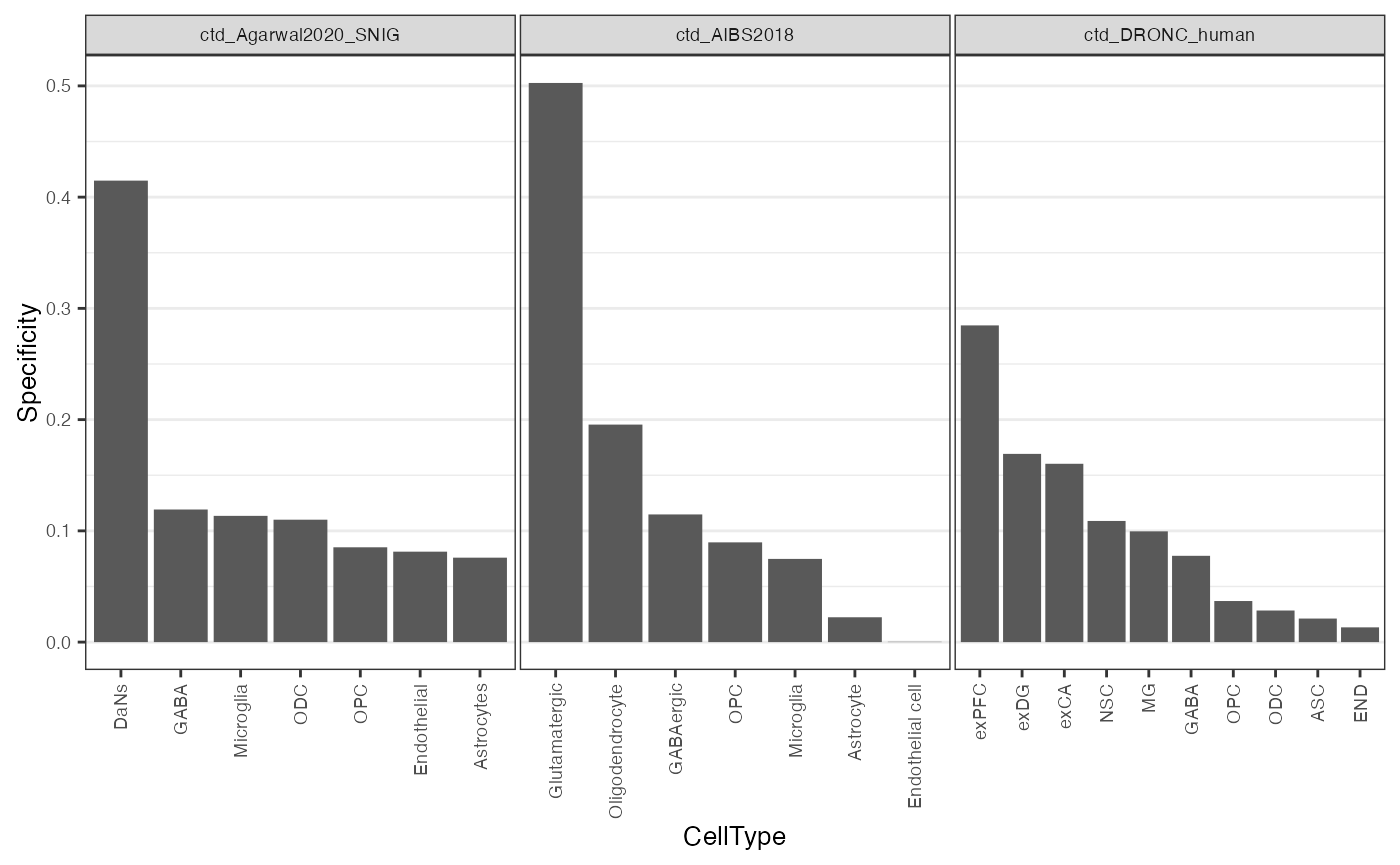
Figure: Plot of SNCA specificity value across three single-nuclear RNA-seq datasets. exPFC=glutamatergic neurons from the PFC, exCA1/3=pyramidal neurons from the Hip CA region, GABA=GABAergic interneurons, exDG=granule neurons from the Hip dentate gyrus region, ASC=astrocytes, NSC=neuronal stem cells, MG=microglia, ODC=oligodendrocytes, OPC=oligodendrocyte precursor cells, NSC=neuronal stem cells, SMC=smooth muscle cells, END= endothelial cells.
- For all three datasets, SNCA appears to have its highest specificity in some form of excitatory neuron.
- Thereafter, the ordering of cell types is a little more ambiguous, and changes slightly dependent on the dataset.